The Skills Audit feature has a comprehensive reporting tool that clearly shows where the areas of strength and weakness lie based on the categories and questions used. These reports can help to identify individual and board training needs.
As the audit can contain both 'Numeric' and 'Text' responses the reporting is in two parts.
To access the reporting tool user the Users, Boards & Reporting link on the main navigator then select the 'Skills Reporting' tab

NOTE: Only users who are members of a 'Board' will be displayed. Even if Governor Records are not being used the users must be allocated to a board.
NOTE: If a user is not showing in the list and is on a board then this is because they have not completed the skills audit.

This will open up the reporting tool. The details of the 'colour key' linked to the values for numeric based questions is displayed (low to high - Red, Amber, Yellow, Light Green, Dark Green).
There are three 'filters' available so you can generate the report that you require.
1. Select the board(s) you wish to report on (in a single school GVO there will only be one). Only boards that you are a member of will be displayed (so, normally only one). GVO Managers see ALL boards.
2. Select the Categories that you wish to see (by default all categories in the audit are selected) - this is helpful if categories have been designed for Governors and different ones for Trustees
3. Select the users that you wish to report on - the list of users will be those people that are on at least one board with you AND that have filled in the audit. If names are missing that is because they are not on the same board as you or they have not filled their responses in. The date that the user last completed the audit is shown. This option is useful to see the impact of a Governor who may be leaving the board so that possible gaps can be identified.
Press APPLY when you have made your choices.
NOTE: Only users where you share a board will be displayed.

The first part of the reporting gives the Category Based Summery, the second part gives the summary by question.
Three reports will appear below - the summary (by category) and the full report (by question) for the NUMERIC questions then the full report (by question) for the TEXT questions..
The results are displayed both numerically and with a 5 colour display.
In both cases the data can be exported to PDF or EXCEL using the buttons at the TOP of each report.
If you wish to see the full list of responses (by category/question/user) then use the 'Detailed Report' option at the very bottom of the screen to download to EXCEL (this does include the date last submitted).
Summary

Detail

Example PDF report

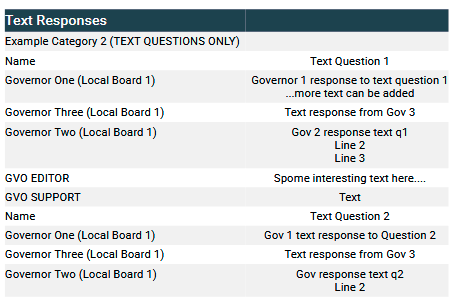
After the numeric reports you will find the Text responses ...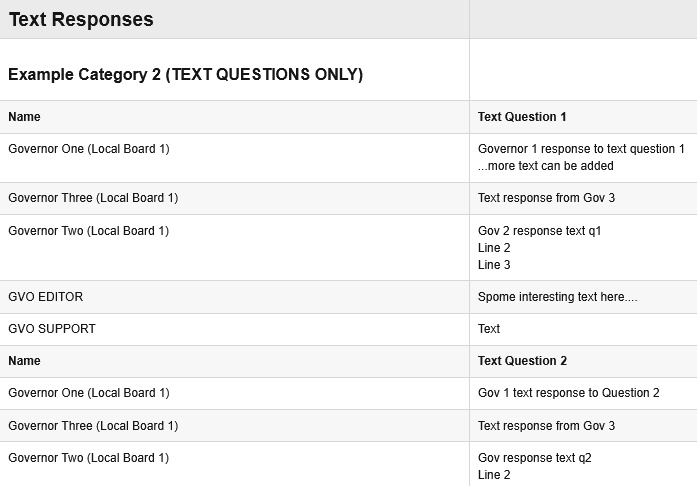
Again, you can generate a PDF or EXCEL download.
The full detailed information can be download to EXCEL using the button at the bottom...